
As we get nearer to the shortest day and the longest night the sunshine becomes an increasingly rare commodity. Our understanding over sunrise and sunset has always seemingly been set in stone...rise in the East, set in the West. Simple, right? IN UK terms, I always visualised that the sun rose over Kent and the line of sunrise crossed the UK going North-West, rising last in Stornoway. I was wrong.
What I didn't realise is that this is only true in Winter. In Summer, it rises first over Lerwick (in the Shetland isles), and advances south-west, rising last over Cornwall. And in Spring and Autumn, the direction is largely East-West. In summer, Lerwick's high latitude means it's possible to play golf at midnight (something their tourist board likes to highlight)
What you're seeing
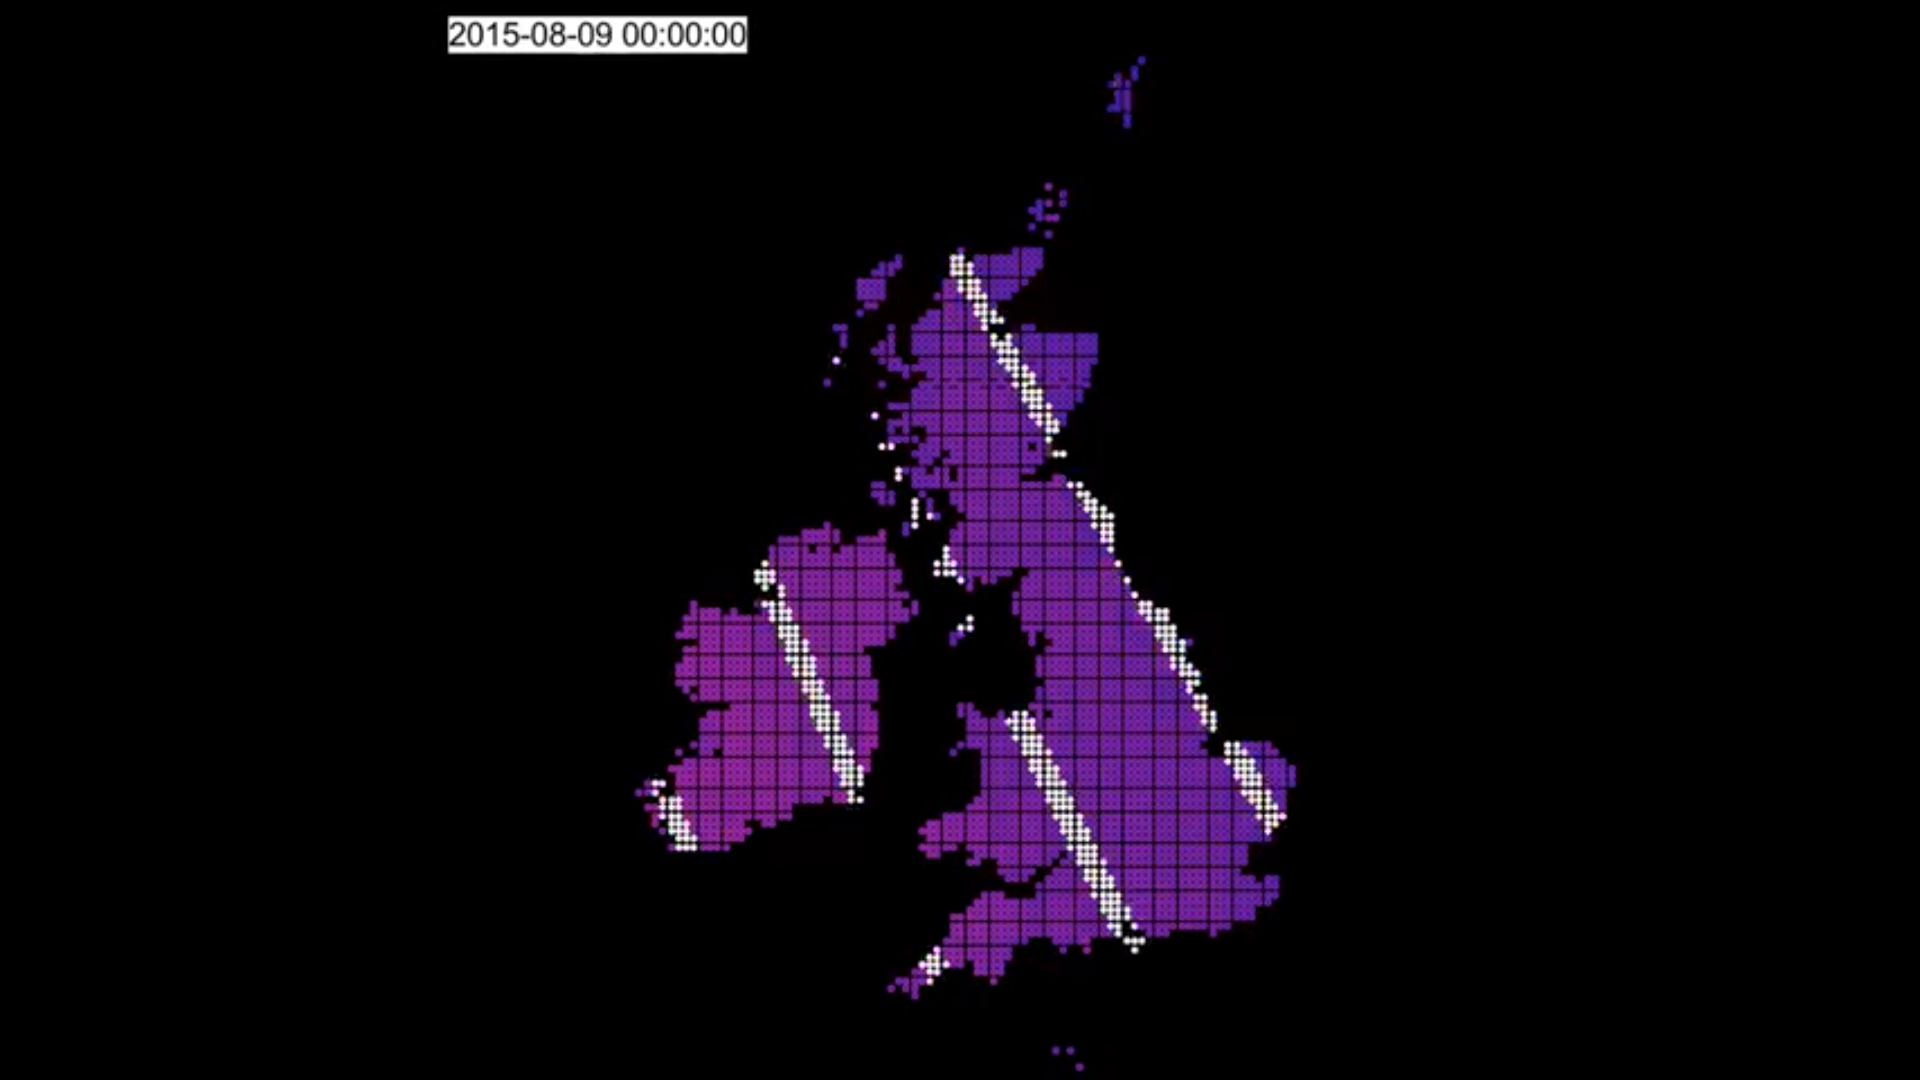
The video loops around throughout the year. The white stripes show contours of 15 minutes' difference in sunrise time. The colours range from red (around 9am) to Blue (around 3am) with purples in the middle. In most cases, it takes the sun about an hour to sweep across the UK.
Note that I've used UTC (which is basically UK time but without Daylight Savings). The reason for this is to avoid the 'jolt' you'd see twice a year when the clocks change.
You can see the date in the top left; this is an option in Time Manager.
How it was done
This animation was done in QGIS using the Time Manager plugin, and with a Python script with ephem.
I used QGIS to divide the UK into a grid of 10km x 10km squares, and ditched those squares which were not over land. The centroids of each square were then exported to CSV with no geometry.
There's a useful Python library called ephem, which allows you to specify an observer point (lat/lon) and get sunrise, sunset times - amongst other things.
Processing the data
A short python script then goes through the year, one day at a time, and computes the sunrise and sunset times for each point. A unix timestamp field is added, defaulting to midnight of each day of 2015. This comes in handy for the next step - the animation. This data is written into a new CSV, and brought back into QGIS as a delimited layer.
Now, I can join the grid squares layer to this delimited layer, based on the timestamp. Time Manager will then render the grid for each "frame" using the timestamp we added in, and using the joined fields to style the layer according to the day of year.
The Time Manager plugin is now configured to step through one day at a time. This means that each day gets rendered as it's own .png file, and the join makes sure the colours change.
Creating the video with ffmpeg
I personally find that I can't get Time Manager to generate the video (perhaps it's just very slow). So instead I use a tool called ffmpeg, which is blazingly fast and has all sorts of cool options. I use this for Blender animations too.
ffmpeg can create movies from a series of .png files, as produced by time manager. Tip: you might want to move or delete the .pngw world files, as these can be interpreted as .png files by ffmpeg if you're not careful.
The mp4 codec can be a bit sniffy if the image dimensions aren't divisible by two, so my command line resizes the input to make sure this is the case.
It's a command line app, so not very friendly (see below)
ffmpeg -r 24 -i ./%04d.png -c:v libx264 -vf "scale=trunc(iw/2)*2:trunc(ih/2)*2" -r 30 -q 1 -pix_fm yuv420p ~/Videos/$1
Assuming using Linux, simply save that as ~/makemovie.sh, go to the directory where Time Manager left the files, and run
~/makemovie.sh mymovie.mp4
A few seconds later you now have an mp4 movie.